
Quick Summary: Why will 2026 push enterprises toward self-healing data platforms? This blog explains how Data Observability 2.0 tackles rising data failures, reduces operational load, and keeps analytics reliable. It reveals what modern teams must adopt now to stay ahead.
Data observability has moved from a niche checklist item to a business requirement: enterprises now need end-to-end visibility into data health, lineage, and runtime behavior so pipelines can auto-detect and correct faults before consumers see bad outputs. Therefore, partnerships with the best data engineering company in USA and investment is rising fast. Moreover, industry research by MarketsandMarkets estimates the broader observability tools and platforms market will reach roughly USD 4.1B by 2028, reflecting double-digit CAGR across cloud and AI workloads.
As data volumes grow and pipelines span cloud warehouses, streaming systems, and AI workloads, visibility alone no longer meets operational needs. Teams now expect systems to reason over data behavior, trace issues automatically, and respond without manual intervention. This shift sets the foundation for Data Observability 2.0, where observability evolves into an active control layer rather than a passive reporting function.
What Is Data Observability 2.0?
Data Observability 2.0 is an operational layer that combines continuous telemetry (metrics, logs, lineage, schema, and tests) with ML-driven anomaly detection, causal tracing, and automated remediation. Instead of just surfacing alerts, modern data observability tools correlate failures across systems, surface root causes, and trigger corrective actions in the orchestration layer or catalog. This lets a data observability platform act as the nervous system for data pipelines.
Evolution: Monitoring to Autonomous Data Systems
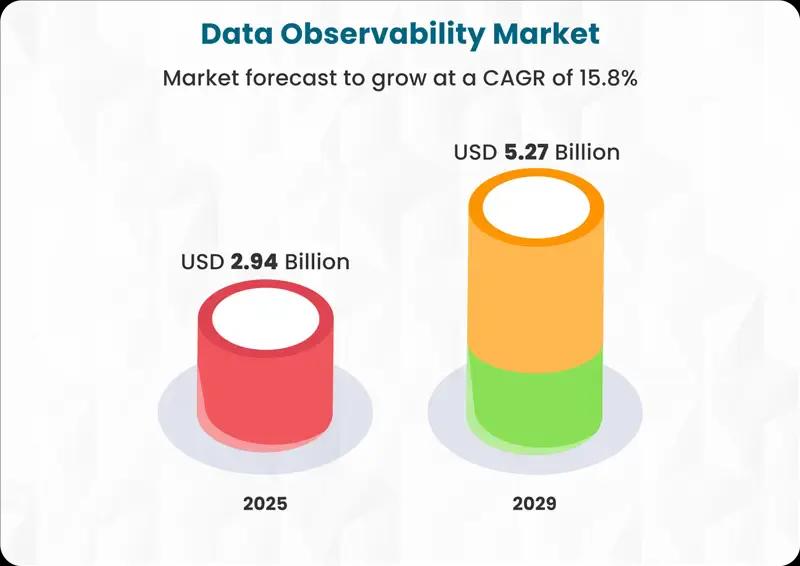
Traditional monitoring watched endpoints; Data Observability 2.0 monitors data semantics and trust. Platforms now ingest statistical fingerprints, lineage graphs, and consumer contracts, then use lightweight ML to score data reliability and auto-roll back, re-ingest, or open targeted remediation jobs. Vendors and vendors' customers are scaling: analysts report the data observability market grew into the low billions in 2024–25 and is expanding at ~11–21% CAGR depending on the forecast.
Why Traditional Observability Is No Longer Enough
Modern analytics and AI demand correctness, not just uptime. Manual alerts create fatigue; disconnected tools hide causal chains. Self-healing platforms reduce mean-time-to-innocence for datasets, the best Data engineering service provider focus on product features, and provide measurable SLAs for downstream models and BI. The market momentum shows organizations prefer unified data observability platforms that combine detection, lineage, and automated fixes in one place. Moreover, by 2026, more than 50% of enterprises will have implemented distributed data architecture and adopted data observability tools to improve visibility over the state of the data landscape, up from less than 20% in 2024.
The 2026 Shift: Why Enterprises Need Self-Healing Data Platforms
Rising Data Volume, Velocity, and Schema Unpredictability
By 2026, enterprise data systems will process continuous streams from SaaS applications, IoT devices, customer interactions, and AI-driven products. Data volume is no longer growing in batches but in real time, while velocity increases due to event-driven pipelines and streaming ingestion. At the same time, schemas change frequently as upstream teams add fields, modify data types, or alter business logic. Traditional rule-based checks struggle in this environment because they rely on static expectations. Self-healing data platforms address this by learning normal data patterns, tracking schema changes automatically, and adapting validation logic as structures evolve.
AI-Led Automation in Modern Data Stacks
Modern data stacks now apply AI to operational tasks once handled manually. Statistical models and lightweight machine learning continuously analyze freshness, distribution shifts, null spikes, and row-count anomalies. When issues occur, automation can rerun failed jobs, pause downstream consumption, or isolate corrupted partitions. Instead of reacting to alerts, teams rely on systems that diagnose causes across ingestion, storage, and orchestration layers, keeping pipelines stable even as workloads scale.
Business Risk of Downtime and Bad Data
Downtime and inaccurate data directly affect revenue, compliance, and decision-making. Delayed reports slow leadership response, while faulty data feeding AI models leads to unreliable predictions. Manual recovery increases mean time to resolution and operational cost. Self-healing platforms by the leading data engineering company reduce these risks by detecting failures early, correcting them automatically, and maintaining consistent data reliability, allowing enterprises to scale analytics and AI initiatives without sacrificing trust or speed.
Core Pillars of Self-Healing Data Systems
Real-Time Anomaly Detection
Self-healing data systems rely on automated anomaly detection to identify issues the moment they appear. Instead of static thresholds, statistical models learn normal patterns for volume, freshness, distribution, and schema behavior. When a sudden spike, drop, or delay occurs, real-time data monitoring flags the deviation immediately, preventing faulty data from flowing into analytics or AI workloads.
Automated Root-Cause Analysis
Detecting an issue is only the first step. Automated root-cause analysis traces anomalies across ingestion jobs, transformations, storage layers, and downstream consumers. By correlating metadata, lineage, and execution logs, the system identifies where the failure originated — such as an upstream schema change or a failed dependency, reducing investigation time and eliminating guesswork.
Intelligent Alert Reduction and Noise Filtering
Traditional monitoring floods teams with alerts that lack context. Self-healing platforms apply intelligent filtering to group related anomalies, suppress duplicates, and prioritize issues based on business impact. This keeps data pipeline health monitoring focused on actionable incidents rather than low-risk fluctuations, improving response efficiency.
Auto-Remediation Workflows (Pipelines, Schemas, SLAs)
Once the root cause is identified, automated workflows take action. Pipelines can be rerun, schemas rolled back, or downstream SLAs temporarily paused to prevent data misuse. These actions happen programmatically, reducing manual intervention and stabilizing data operations under continuous change. You can hire data engineers and establish auto remediation workflows on your terms.
Continuous Data Quality Scoring
Finally, data quality monitoring assigns ongoing reliability scores based on completeness, freshness, and consistency. These scores give stakeholders a clear view of dataset trustworthiness, supporting confident decision-making across analytics and AI use cases.
Key Capabilities Leaders Should Look For
Cross-Platform Lineage (Warehouse, Lakehouse, Streaming)
Modern data ecosystems span warehouses, lakehouses, and real-time streaming platforms. Leaders should prioritize data lineage tracking that works across all these environments, not just within a single tool. End-to-end lineage shows how data moves from source systems through transformations to dashboards and AI models. This visibility makes it easier to assess downstream impact when a pipeline breaks or a schema changes.
LLM-Powered Metadata Intelligence
As data environments grow, manual metadata management becomes impractical. LLM-powered metadata intelligence uses language models to interpret logs, schema changes, and usage patterns, converting raw metadata into clear explanations. These systems can summarize incidents, suggest probable causes, and surface ownership information, allowing teams to understand complex data behavior without deep manual analysis.
Policy-Driven Automation
Self-healing platforms must enforce operational rules automatically. Policy-driven automation allows teams to define conditions such as freshness thresholds, access controls, or compliance requirements. When policies are violated, the system triggers predefined actions like pausing data consumption, rerunning jobs, or notifying the correct owner. This keeps data operations consistent and auditable.
Predictive Pipeline Reliability
Rather than reacting to failures, advanced platforms apply predictive data reliability models to anticipate issues. By analyzing historical runs, dependency patterns, and load trends, systems can forecast which pipelines are likely to fail and schedule preventive actions before disruptions occur.
Federated Monitoring for Multi-Cloud Setups
Enterprises increasingly run data workloads across multiple clouds. Federated monitoring unifies metrics, logs, and lineage from all environments into a single view, allowing teams to manage reliability without switching tools or losing context across platforms.
How Self-Healing Platforms Reduce Costs and Operational Burden
Lower Engineering Toil
Self-healing data platforms significantly reduce repetitive operational work supported by AI-driven data observability and top AI-powered data engineering tools. Instead of manually checking logs, rerunning jobs, or validating outputs, engineers rely on systems that automatically detect deviations and trigger corrective actions. This shift reduces on-call fatigue and allows teams to spend more time on feature development and optimization rather than constant firefighting.
Faster Issue Resolution Times
Issue resolution accelerates when detection, diagnosis, and response are automated. Platforms enabled through data observability tools correlate anomalies across pipelines, storage layers, and consumers to identify root causes quickly. Automated reruns, rollbacks, or dependency isolation reduce mean time to resolution, allowing data services to recover before downstream users are affected.
Fewer False Alarms
Traditional monitoring generates excessive alerts due to rigid thresholds and isolated checks. Self-healing systems use contextual analysis to group related anomalies and suppress low-impact fluctuations. This intelligent filtering improves signal quality, so teams respond only to incidents that pose real operational or business risk.
Improved SLA Adherence
Self-healing platforms actively protect service-level agreements by monitoring freshness, completeness, and delivery timelines in real time. When risks appear, automated actions such as pausing downstream consumption or prioritizing critical pipelines maintain consistent SLA performance without manual intervention.
Reduced Business Disruption
By correcting failures early and preventing unreliable data from spreading, self-healing systems limit disruptions to reporting, analytics, and AI-driven applications. Consistent data reliability reduces downstream rework, missed decisions, and revenue-impacting delays, lowering overall operational cost while supporting business continuity.
Real-World Use Cases for 2026
Automated Schema Drift Handling
By 2026, schema changes will occur frequently as product teams update applications and data sources evolve. Self-healing platforms detect column additions, removals, and data type changes automatically. Instead of breaking pipelines, systems apply compatible schema updates, adjust validations, or quarantine affected fields. This approach prevents data failures caused by unexpected upstream changes while keeping analytics and downstream models operational.
AI-Driven Pipeline Health Monitoring
Enterprises increasingly rely on data pipeline health monitoring to maintain reliability at scale. AI models analyze historical pipeline runs, dependency patterns, and execution metrics to identify early signs of failure. When risk thresholds are crossed, systems can rerun jobs, prioritize critical workloads, or isolate unstable dependencies, maintaining consistent pipeline performance without manual intervention.
Streaming Data Stability
Real-time applications depend on uninterrupted data flow. For streaming environments, real-time data monitoring tracks latency, event loss, duplication, and out-of-order records. Self-healing platforms automatically rebalance consumers, restart failed stream processors, or apply backpressure controls. This keeps dashboards, alerts, and real-time AI features accurate even during traffic spikes or infrastructure fluctuations.
Governance and Compliance Automation
Regulatory and internal policies require constant oversight of data usage. Self-healing systems automate governance by monitoring access patterns, data retention rules, and policy violations. When issues arise, actions such as masking sensitive fields or restricting access are applied automatically, maintaining compliance while reducing manual audits and operational overhead.
Build vs. Buy: Decision Framework for Enterprises
Cost Comparison
Building an in-house self-healing data platform requires sustained investment in tooling, infrastructure, and specialized talent. Engineering teams must develop monitoring logic, automation workflows, and maintenance processes that scale with data growth. In contrast, partnering with a data engineering company or adopting proven platforms often shifts costs to predictable licensing or service fees, reducing upfront development expense and ongoing operational overhead.
Engineering Maturity Requirements
Custom-built systems demand a high level of engineering maturity. Teams need experience in distributed systems, data reliability patterns, and automation design to manage failures effectively. Enterprises lacking this depth often struggle with incomplete solutions. Leveraging data engineering services allows organizations to access specialized expertise without expanding internal teams beyond sustainable limits.
Integration Complexity
Modern data ecosystems include warehouses, lakehouses, streaming platforms, and BI tools. Building solutions internally requires tight integration across all these components, along with continuous updates as technologies change. Buying or partnering typically provides pre-built connectors, lineage support, and standardized interfaces, reducing integration risk and accelerating deployment.
Long-Term Scalability
Scalability goes beyond handling larger data volumes. Self-healing platforms must support new data sources, evolving schemas, and growing user demand over time. In-house solutions may face limitations as complexity increases. Established platforms and experienced service providers design systems with extensibility and reliability in mind, supporting long-term growth without constant redesign or escalating maintenance effort.
Implementation Roadmap for Modern Teams
Readiness Assessment
The first step toward self-healing data systems is evaluating current readiness. Teams should review pipeline reliability, incident frequency, data quality gaps, and manual intervention levels. This assessment identifies which workflows cause the most disruption and where automation delivers immediate value. Many organizations choose to hire data engineers at this stage to audit existing pipelines and define clear reliability baselines.
Pilot to Scale Approach
Rather than applying automation across the entire data stack at once, successful teams start with a focused pilot. A small set of high-impact pipelines is selected to validate anomaly detection, automated remediation, and alert reduction. Once stability improves and measurable gains appear, the approach scales incrementally across additional data domains with lower risk and faster adoption.
Automation Layering Strategy
Automation should be introduced in layers, starting with monitoring and diagnostics, then advancing to corrective actions. Teams first automate detection and root-cause identification, followed by controlled actions such as reruns or schema handling. Partnering with a Data engineering company can accelerate this layering by applying proven patterns and reusable workflows.
KPI Dashboards to Track Impact
Clear KPIs keep implementation aligned with business outcomes. Dashboards typically track incident volume, mean time to resolution, SLA adherence, and data quality scores. Monitoring these metrics over time shows how self-healing systems reduce operational burden while improving reliability across analytics and AI workloads.
Final Checklist for Choosing a Data Observability 2.0 Platform
Must-Have Features
A modern platform should cover end-to-end visibility across pipelines, schemas, freshness, volume, and downstream usage. Core data observability tools must include anomaly detection, lineage mapping, data quality checks, and incident context in one interface. Fragmented features increase operational overhead and slow issue resolution.
AI and Automation Maturity
Not all platforms apply AI at the same depth. Look for solutions where machine learning drives pattern learning, anomaly correlation, and automated actions rather than static rules. A mature data observability platform supports automated reruns, schema handling, and alert prioritization, reducing manual effort as data complexity grows.
Compatibility With Your Data Stack
Enterprises operate diverse stacks that include warehouses, lakehouses, streaming platforms, and BI tools. The platform should integrate natively with your existing technologies and support open metadata standards. Broad compatibility avoids lock-in and allows observability to scale as new tools are added.
Security and Compliance Requirements
Data observability systems handle sensitive metadata and operational signals. Leaders should evaluate access controls, encryption, audit logging, and compliance support. The right platform aligns with internal governance rules and external regulations while maintaining visibility without exposing restricted data.
Preparing for Data Observability 2.0 in 2026
As enterprises move toward 2026, self-healing data platforms will shift from a competitive advantage to an operational requirement. Data reliability, automation, and scalability now define how effectively analytics and AI initiatives perform at scale. Organizations must evaluate whether to hire data engineers with deep observability expertise or partner with a trusted data engineering company to build resilient systems that reduce risk, control costs, and sustain data trust as complexity continues to grow.

Written by
Pratik Kantesiya
AI Engineering Lead
Pratik leads AI engineering at Agile Infoways, where he architects production AI systems for enterprises across healthcare, BFSI, and logistics. He writes about practical AI delivery — what works, what does not, and what most teams miss between proof-of-concept and production.